| (1) |
where:
| G | = | total gap |
| T | = | target thickness |
| A | = | gap from sensor 1 to target |
| B | = | gap from sensor 2 to target |
To solve for target thickness (Figure 2) we can rewrite the equation, solving for T. This isn't a serious issue when using absolute sensors such as capacitance probes; you can run the voltage outputs into a summing amplifier that inverts the output. When using sensors that have a relative calibration with bipolar outputs, as shown in Figure 3, it is slightly more difficult to compute the thickness. For example MTI's Microtrak II controller outputs a bipolar ± 5 V voltage centered about the specified standoff distance. You can't run the analog outputs into an inverting summing amplifier because the Microtrak's output voltage polarity changes, resulting in errors when you pass through the center of the range. Mathematically the thickness equation looks like Equation 2:
| (2) |
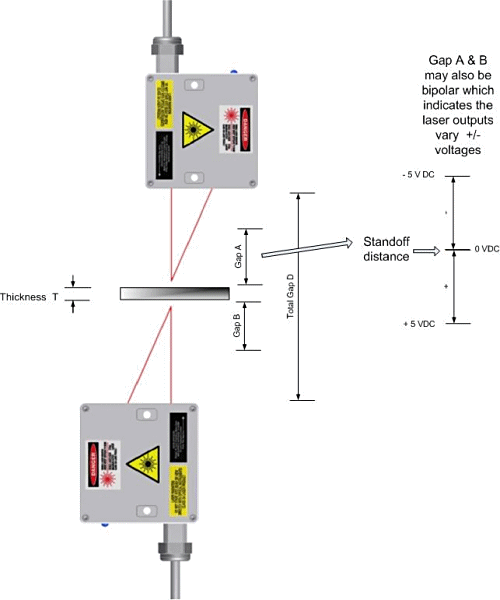 Figure 3. Using sensors that have a relative calibration and bipolar outputs |
Practically speaking, most users ignore the standoffs and treat them as one big DC offset and only deal with the active range of the heads once they're set up. For example, we could sum 5 VDC with each of the heads to make the controller output always positive (0–10V unipolar) and then sum the two outputs, invert the output, and run it into a voltmeter. After setup, place a target of known thickness—the golden target—between the lasers and then zero the meter. All readings are now relative to the target with known thickness. Multiply the voltmeter's voltage by the sensitivity factor of the laser heads to get the change in thickness relative to the golden target.
Displaying the Thickness Data
There are many ways to display the thickness data depending on your budget and how elaborate your measurement setup is. One simple method that can be used for one to three slow-speed thickness channels (with two heads per thickness channel) is to connect stand-alone measuring heads to a laptop computer through an RS-485 to USB converter. One converter can handle from one to six heads to provide up to three thickness points. The heads all tie in parallel to the same USB converter and the heads are addressed individually by the display software (Figure 4).
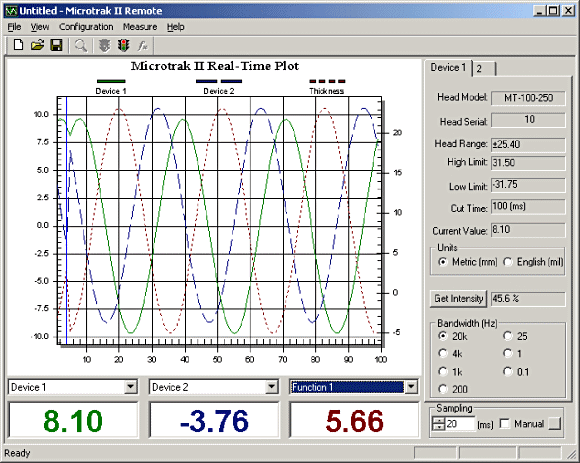 Figure 4. The display shows a real-time plot of the individual head's displacement and the resulting thickness measurement |
For those who do not like programming or don't have the time, another solution is to use a precision analog summing amplifier with two laser heads, a digital panel meter (Figure 5), and a switch. This allows you to select between individual heads during setup and then to select the thickness module's output when running. Typically, once the heads are set up you insert a target of known thickness and adjust the thickness module to 0 V. Many panel meters also have one or more built-in alarm contacts that allow triggering an alarm event based on voltage set points.
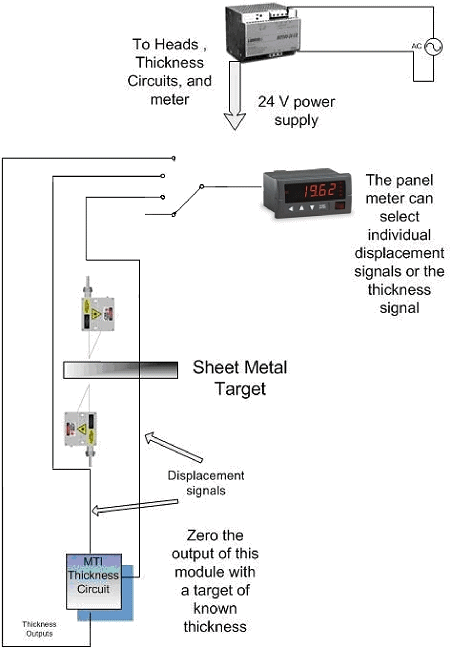 Figure 5. Using a precision summing amplifier, two laser heads, and a panel meter, you can display thickness data |
High-speed systems for industrial control and alarming require higher speed communications. Ethernet connections allow communication speeds of up to 100 Mbps and there are a number of off-the-shelf analog to digital converter (ADC) components available to build such a system.
In the system shown in Figure 6, a precision MTI thickness module is used to combine the analog outputs from the laser heads and to provide a high-speed, real-time analog thickness signal. Advantech ADAM 6017 DA modules convert the thickness and individual displacement readings into high-speed Ethernet packets that are read by an off-the-shelf HMI. Advantech ADAMView software ties the whole system together. An extra ADAM module used in conjunction with a proximity sensor alerts the system that a target is present if discreet sheets are being measured. A standard multiport Ethernet switch ties all the Ethernet cables together.
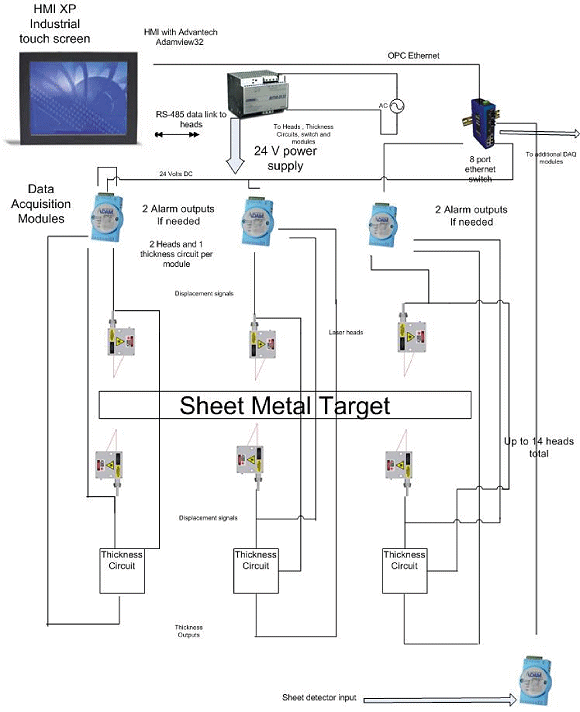 Figure 6. Coupling laser sensors with DA modules and an HMI provides high-speed analog thickness data |
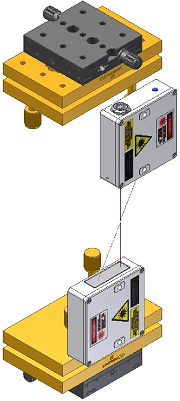 Figure 7. Two Newport tilt (Newport #39) and yaw (Newport TSX-1D) adjustable stages are shown with MTI lasers attached |
Fixturing
If the laser heads are not properly mounted you will see incorrect thickness readings and perhaps unexplained variation (linearity error) in thickness as the actual thickness varies. The first order error due to tilt is shown in Equation 3:
| (3) |
where:
| cos(θ) | = | tilt angle |
A 3° tilt at 25 mm standoff results in a 34 µm error. The more precise the reading needs to be, the more precise the laser fixturing required. If measuring plywood to an accuracy of 0.1 in., it is okay to use mounting brackets that are slotted for tilt and yaw. If you're trying to get down to 40 µin. accuracy you'll need two-axis mounts with fine screw adjustments (Figure 7).
Pay attention to the overall sensor support structure—cantilevered sensor holders without proper support have inherent resonant frequencies and can turn into giant tuning forks where the oscillation interferes with the reading. A preferred approach is to use a sensor holding structure that bridges both sides of the target and uses stiff supports on both sides of the target (Figure 8).
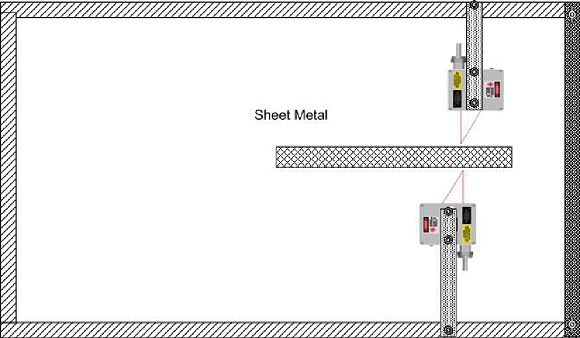 Figure 8. Proper design concept where both sides of the sensor supports are fixed to prevent unwanted vibration. One side can be made removable so the structure is easily disassembled for access or service |
Laser Adjustment
One of the simplest ways to adjust the lasers is first to adjust their standoff to the target for nominal center-of-the-range standoff distance. Remove the target and replace it with a flat sheet of translucent white paper so the two laser spots may be observed simultaneously. The sheet of paper should be at the same location as the target material would be. Next, adjust the heads such that the spots remain superimposed upon each other as the paper is moved back and forth between the range of the lasers in a perpendicular direction. As you move the paper back and forth, perpendicular to the heads, you'll see one spot gets larger while the other gets smaller. This is because the laser beams are focused at the nominal standoff distance. As you move away from the nominal standoff, the beams expand. Once you have the laser adjusted for continuous concentric coaxial alignment throughout the range (Figure 9) be sure to lock the adjustment screws down or cap them to prevent unauthorized users from tampering with them.
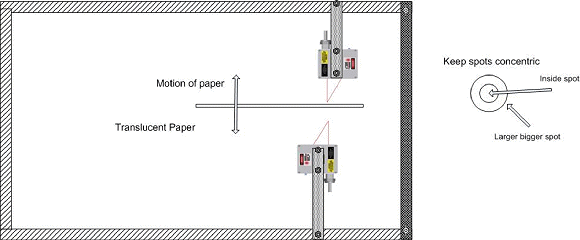 Figure 9. A set up to adjust the lasers |
System or Thickness Calibration
Although the individual laser heads are already calibrated, you'll have to calibrate the assembled system for thickness. Place a target of known thickness in between the lasers and tare the system to zero or set the readout device to read the actual thickness of the known target. The system function for thickness is Thickness = Total gap – (laser gap 1 + laser gap 2).
Overall System Accuracy
Assuming you haven't introduced any additional error with poor fixturing, the overall measurement uncertainty will be 2*max linearity error + 0.5 the peak-to-peak (pk-pk) noise at the bandwidth selected because you're using two heads. For a head linearity of ± 0.05% F.S. where F.S. = 10 mm, if the dynamic noise for the same heads is 3 µm pk-pk then the total measurement error could be as high as 10 µm + 1.5 µm = 11.5 µm.
Fixture vibration and surface finish effects will also add to this uncertainty, and could easily increase the uncertainty to 23 µm. Most laser head dynamic noise or uncertainty is given at a specific bandwidth and when measuring to white paper. Actual targets can easily cause larger pk-pk noise values. Averaging techniques such as low-pass filtering or a digital moving average can help reduce uncertainty due to surface finish effects and head noise and can sometimes make an impossibly noisy measurement both possible and statistically useful.
Closing Thoughts
The above are just a few ideas to help make your thickness setup as foolproof as possible. Following these guidelines will help ensure the highest accuracy and repeatability of your thickness data.
联系人:卢小姐
手机:(0)13459262201
电话:0592-5509366售后热线:400-0592-898
邮件:info@robo-sight.com
地址:集美区厦门火炬高新区软件园三期溪西山尾路39号C07栋19楼